Summary
- Ookla analysed more than 50 million mobile signal scans collected across Greater London between 25 March and 30 April 2026.
- 5G accounted for 19.8% of connected below-ground scans, compared with 16.5% across Greater London above ground.
- Median underground 4G signal strength was -96dBm, although streets directly above the platforms retained a 2dB to 3dB advantage.
- The detected connections closely followed the station and tunnel sections marked as active on TfL’s official coverage map.
- The study measured coverage and signal strength but did not test mobile data speeds, latency, call reliability or congestion.
New real-world mobile data has provided an independent view of 4G and 5G coverage across the London Underground, with connected devices closely following the sections that Transport for London has brought online.
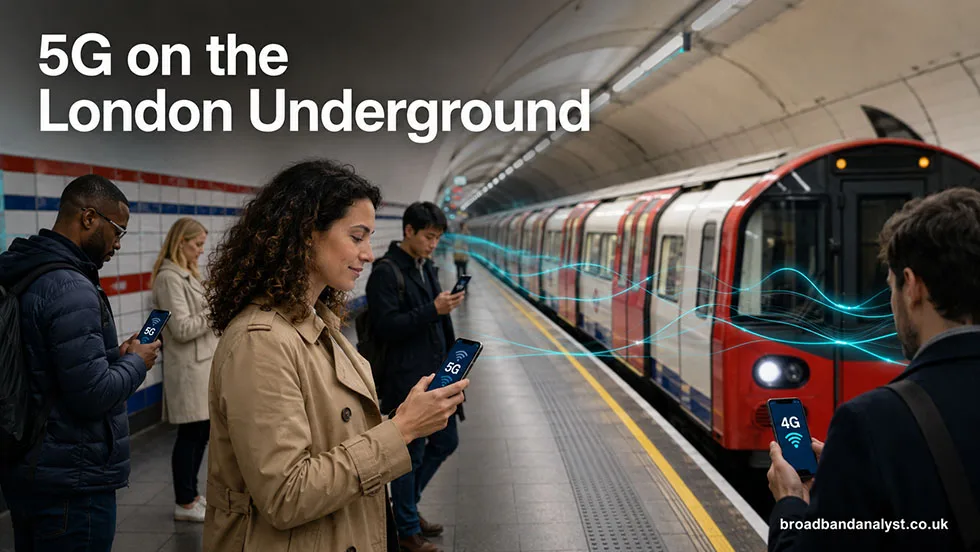
Ookla analysed more than 50 million background signal scans collected across Greater London. Almost one in five connected scans identified as below ground used 5G, while 4G signal strength remained close to street-level performance.
The results indicate that Boldyn Networks’ shared mobile infrastructure is delivering usable signals deep inside stations and tunnels. However, the research does not confirm whether passengers receive fast mobile data, low latency or uninterrupted calls during their journeys.
Mobile Signals Traced Across the Tube
The research used mobile signal measurements collected between 25 March and 30 April 2026. These came from anonymised, opt-in Android devices moving across Greater London.
Identifying underground measurements presented a challenge because ordinary location data cannot always distinguish a platform from the street above it. Ookla developed a classification method using the device’s corrected elevation, estimated distance below the local ground surface and proximity to a London Underground tunnel.
Only measurements with a high probability of being below ground were included. Individual station areas also needed at least 500 measurements before station-level results were published.
This method produced data for more than 100 below-ground station areas. Interchange stations can combine readings from several lines because each scan was assigned to its nearest station rather than a particular platform.
The scans show only devices with an active mobile connection. They can establish the location and strength of successful connections but cannot create a complete map of places with no service.
TfL’s live sections appear in the data
Connected underground scans followed many of the tunnel sections that TfL had already marked as active, including routes through central London and extended sections of the Northern line.
Measurements were concentrated between Shepherd’s Bush and Liverpool Street, as well as between Brixton and Highgate. They became less frequent near the edges of the completed network.
Some signals appeared at shallow stations beyond the dedicated rollout. These connections can come from outdoor mobile masts reaching platforms at cut-and-cover stations, particularly on parts of the Circle and Metropolitan lines.
Such readings should not be treated as confirmation that Boldyn’s underground equipment has been activated. Dedicated tunnel coverage uses antennas and special cables installed within the transport network, while surface coverage can disappear as soon as a train enters a deeper section.
The collection period also ended on 30 April. TfL activated additional stations and tunnels after that date, so individual station results describe the network during the study rather than its current position.
5G takes a larger share underground
5G accounted for 19.8% of the connected below-ground scans. The equivalent share across Greater London above ground was 16.5%.
This does not mean that 19.8% of the London Underground has 5G coverage. It describes the proportion of successful underground connections using 5G rather than 4G during the measurement period.
The result reflects an underground network that included 5G equipment from an early stage. Device compatibility, the customer’s mobile plan, available frequency bands and each operator’s configuration can still affect whether a phone selects 4G or 5G.
O2 recorded the largest underground 5G share at 26.5%, while Three recorded the lowest at 12.8%. These percentages do not establish which operator offers faster or more reliable service below ground.
The original Jubilee line pilot section remains an exception because much of it continues to use 4G-only equipment. Below-ground 5G accounted for 4.2% of scans at Southwark, 6.7% at Bermondsey and 10.4% at Canada Water, compared with 19.8% across the full underground dataset.
Small amounts of 5G in these areas can come from nearby completed sections or signals reaching shallow parts of a station from outside.
Underground 4G Comes Close to Surface Levels
Median 4G signal strength across the below-ground scans was -96dBm, compared with -98dBm at street level across Greater London.
Mobile signal strength is measured in decibel-milliwatts, or dBm. Readings closer to zero indicate a higher-powered signal, meaning -96dBm is better than -101dBm.
The initial comparison therefore places underground 4G slightly ahead of the Greater London street-level median. However, most connected Tube sections pass underneath central London, which has a particularly dense outdoor mobile network.
A location-based comparison produced a more balanced result. When underground scans were compared with street-level scans from the same small areas, outdoor signals were between 2dB and 3dB better.
The difference remains relatively small given that many platforms are separated from outdoor mobile masts by layers of ground, buildings and tunnel infrastructure.
Underground 4G also recorded a median signal-to-noise result of 2dB, compared with 0dB at street level. Dedicated equipment inside stations can reduce interference from competing signals, although this measurement still does not predict the mobile data speed available to an individual passenger.
Mobile Signals Reach Deep Tube Platforms
Median 4G signal strength remained between -94dBm and -96dBm across the first 30 metres of estimated depth. Beyond 30 metres, it declined to -101dBm.
The share of connected scans using 5G fell with depth. It decreased from 21% in the shallowest group to 14% among the deepest measurements.
Where a 5G connection was available below ground, its median signal strength reached -93dBm. The Greater London street-level 5G median was -98dBm, although the concentration of completed coverage beneath central London again affects this citywide comparison.
Hampstead recorded a median 4G result of -82dBm despite being the deepest station on the Tube network. Chancery Lane recorded -80dBm, the highest station-area median in the study.
These results show that the physical depth of a platform becomes less important once an antenna has been installed nearby. The signal no longer needs to travel from a mast at street level through soil and building materials.
The depth values are estimates rather than engineering measurements of the platforms. The method has a typical tolerance of approximately three metres and indicates the likely position of each scan below local ground level.
Four networks share one system
Boldyn Networks operates the shared underground infrastructure under a 20-year concession awarded by TfL in June 2021.
Instead of each operator installing a separate network through the Tube, Boldyn installs common antennas, cabling and equipment rooms. EE, O2, Three and Vodafone connect their radio equipment and licensed mobile spectrum to this shared system.
Special radiating cables act as long antennas through the tunnels, while distributed antennas serve platforms, passageways and ticket halls. More than 2,000 kilometres of cabling will have been installed when the wider project is complete.
EE accounted for 33% of the connected below-ground scans, followed by Three at 24%, Vodafone at 21% and O2 at 20%. Virtual operators and overseas customers roaming on UK networks produced the remaining 2%.
Vodafone and Three completed their merger in May 2025 but continued to appear as separate radio networks in the underground results. Future integration could reduce the number of separate national networks using the infrastructure from four to three.
The same underground system will also carry the Emergency Services Network. Once operational, this will give police, fire and ambulance crews access to mobile voice and data services across stations and tunnels.
The 2026 deadline approaches
TfL reported in June 2026 that 60% of the 121 below-ground Tube stations had mobile coverage. An updated map published in August shows the tunnel sections currently offering 4G and 5G.
The entire London Underground remains scheduled to receive mobile coverage by the end of 2026. The deadline is two years later than the original end-of-2024 target.
Installation can take place only during limited overnight engineering hours when passenger trains are not operating. Large interchange stations must also be activated in stages because platforms, ticket halls and connecting passageways require separate equipment.
The entire Elizabeth line gained mobile coverage in December 2024. Work is also extending to underground sections of the Docklands Light Railway and the Windrush line between Highbury & Islington and New Cross.
Further sections of the Bakerloo, Metropolitan, Circle and District lines received coverage during 2026. Major stations including Paddington, Victoria and King’s Cross St Pancras have been gaining service in phases because of their size and engineering complexity.
Mobile Speeds Still Need Testing
The Ookla findings confirm that connected phones can receive 4G and 5G signals across much of the completed underground network. They also indicate that signal strength is close to the level available on nearby streets.
Signal strength alone cannot confirm the overall passenger experience. A phone can display several signal bars while delivering slow mobile data if too many passengers share the available network capacity.
The study did not measure download speeds, upload speeds or latency. It also did not examine call setup times, dropped calls, congestion during peak travel periods or the transfer of an active connection between stations and tunnels.
Journey-based testing will be needed to compare the four operators and establish whether mobile service remains fast and reliable on moving trains.
The current results still provide important independent confirmation of the rollout. TfL’s coverage map broadly aligns with connections recorded by passengers’ phones, while 5G already accounts for 19.8% of connected scans below London.