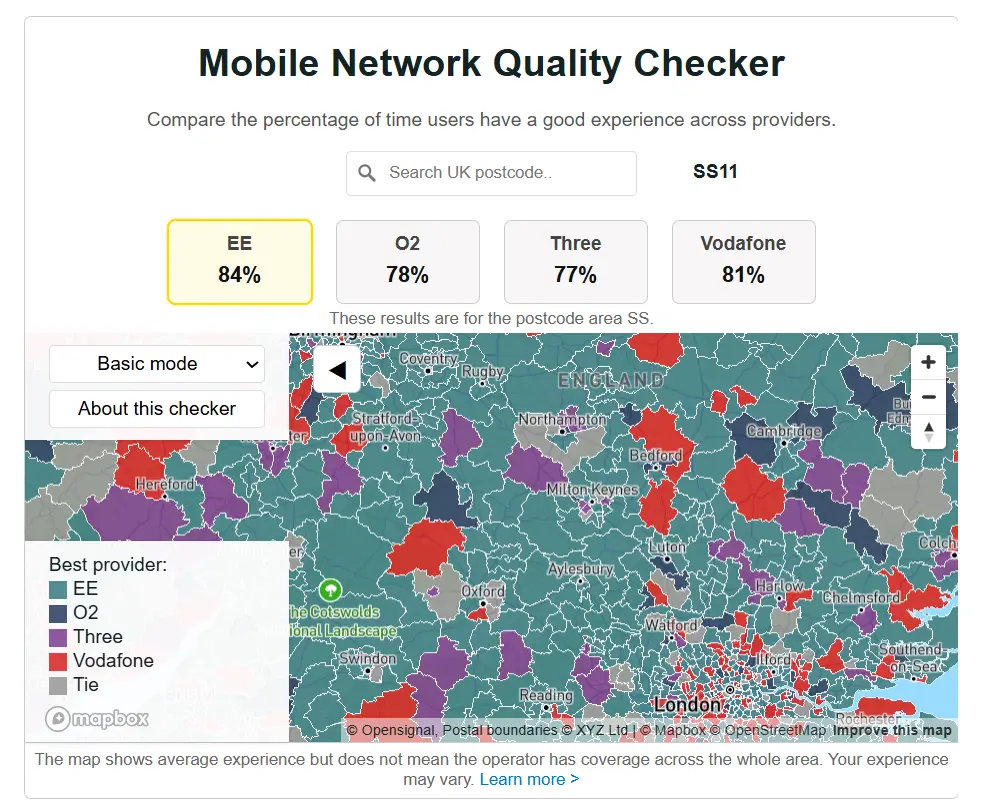
Which? have partnered with Opensignal to release a postcode-by-postcode breakdown of mobile service reliability in the UK, using over a year’s worth of app-based data collected up to August 2025. The results show how often users were able to access a usable connection, expressed as a consistency percentage, with figures published separately for EE, O2, Three and Vodafone as well as an overall district average.
This approach highlights the importance of reliability alongside raw speeds, because it measures how often the connection is good enough for everyday tasks like web browsing, social media, video calling and streaming, rather than only reporting maximum throughput figures.
Unlike coverage maps that show where signal should be available, these results show how networks actually perform in the real world, across millions of tests taken by users on different devices, in varied environments and at different times of day.
The figures confirm a clear divide between different parts of the country. Urban areas consistently scored higher, while coastal and rural locations in Wales and the South West struggled. London’s SE11 district came top with an average score of 87.8 per cent, thanks to consistently high marks across all four networks, closely followed by Nottingham’s NG3.
In contrast, Tenby’s SA70 district recorded the lowest average with just 54.3 per cent of tests meeting the required threshold. Within that figure there were sharp variations, with EE delivering a usable connection 71 per cent of the time, Vodafone 63 per cent, O2 45 per cent and Three only 38 per cent. Other low scorers included areas around Swansea and Truro, reflecting the patchier performance in these regions.
Consistency is calculated using Opensignal’s Consistent Quality metric. This looks at whether a mobile connection can support common activities like video calls or streaming without interruption. It does not measure peak speeds or capacity, so it is possible to have full signal bars on a device while still experiencing slow downloads if the local mast is congested or limited by backhaul. For that reason, consistency scores complement, rather than replace, speed test data and coverage maps.
The study sits alongside Ofcom’s Map Your Mobile tool, which also uses real-world measurement data and has recently been updated to provide postcode-level detail at a 50-metre grid resolution. While Which?’s report focuses on the experience of using the networks day to day, Ofcom’s map provides additional information about predicted coverage and performance. Checking both can give consumers a fuller picture before choosing or switching networks.
The reasons for the postcode gaps are straightforward but important. Network density varies by operator, spectrum resources differ, and some areas have stronger backhaul connections than others. Environment and geography play their part too, with hills, coastline, foliage and buildings all interfering with mobile signals. Seasonal demand can also make a difference, particularly in tourist towns like Tenby where the networks face sudden peaks in traffic.
For consumers, the advice is to check your home and work postcodes using both Which?’s quality map and Ofcom’s checker, and to consider a short trial or pay-as-you-go SIM before committing to a long contract. Wi-Fi Calling at home can help offset patchy indoor coverage, and some operators offer boosters or femtocells in certain cases. Networks are continually upgrading too, so the picture will change as the Shared Rural Network rolls out and as operators add new 5G sites or refarm spectrum.
The methodology matters because these are crowdsourced tests taken directly from Opensignal apps. That ensures large sample sizes, but results can vary as different devices have different radio performance, and as people move between indoor and outdoor locations. The report does not separate 4G and 5G results, so readers should be cautious about making assumptions about which generation of technology is responsible for better or worse scores.
At a glance, the report confirms that mobile reliability is far from uniform across the UK. The best and worst districts illustrate the gap starkly, with a difference of more than 30 percentage points between London SE11 and Tenby SA70. For everyday users, the key takeaway is that operator choice and postcode still matter greatly, and that headline speed claims should always be weighed against real-world consistency.